Search for Indicators

CDC PLACES

CDC PLACES

The PLACES Project is a collaboration between CDC, the Robert Wood Johnson Foundation (RWJF), and the CDC Foundation (CDCF). PLACES will allow counties, places, and local health departments regardless of population size and urban-rural status to better understand the burden and geographic distribution of health-related outcomes in their jurisdictions and assist them in planning public health interventions.

PLACES is an extension of the original 500 Cities Project that provided city and census tract estimates for chronic disease risk factors, health outcomes, and clinical preventive services use for the 500 largest US cities. The PLACES Project provides model-based population-level analysis and community estimates to all counties, places (incorporated and census designated places), census tracts, and ZIP Code Tabulation Areas (ZCTAs) across the United States. See a Notice to Data Users and learn more about the PLACES Project.

Use the drop-down menu below to see data at different locales. 

Indicator Gauge Icon Legend

Legend Colors

Red is bad, green is good, blue is not statistically different/neutral.

Compared to Distribution

an indicator guage with the arrow in the green 
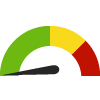
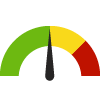
the value is in the best half of communities.

an indicator guage with the arrow in the yellow 
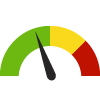
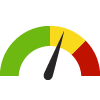
the value is in the 2nd worst quarter of communities.

an indicator guage with the arrow in the red 
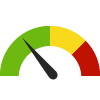
the value is in the worst quarter of communities.

Compared to Target

green circle with white tick inside it meets target; red circle with white cross inside it does not meet target.

Compared to a Single Value

green diamond with downward arrow inside it lower than the comparison value; red diamond with downward arrow inside it higher than the comparison value; blue diamond with downward arrow inside it not statistically different from comparison value.

Trend

green square outline with upward trending arrow inside it green square outline with downward trending arrow inside it non-significant change over time; green square with upward trending arrow inside it green square with downward trending arrow inside it significant change over time; blue square with equals sign no change over time.

Compared to Prior Value

green triangle with upward trending arrow inside it higher than the previous measurement period; green triangle with downward trending arrow inside it lower than the previous measurement period; blue equals sign no statistically different change  from previous measurement period.

More information about the gauges and icons

County: Miami-Dade

Health / Alcohol & Drug Use

Value
Compared to:

County: Miami-Dade

Health / Alcohol & Drug Use

Value
Compared to:

County: Miami-Dade Adults who Binge Drink

Current Value:

County: Miami-Dade Adults who Binge Drink

12.9%
(2020)
Compared to:
Compared to FL Counties, Miami-Dade has a value of 12.9% which is in the best 50% of counties. Counties in the best 50% have a value lower than 14.1% while counties in the worst 25% have a value higher than 15.1%.
FL Counties
The distribution is based on data from 67 Florida counties.
Compared to U.S. Counties, Miami-Dade has a value of 12.9% which is in the best 50% of counties. Counties in the best 50% have a value lower than 15.5% while counties in the worst 25% have a value higher than 17.4%.
U.S. Counties
The distribution is based on data from 3,141 U.S. counties and county equivalents.
Compared to the US Value (15.5%), Miami-Dade has a value of 12.9% which is lower and better.
US Value
(15.5%)
The regional value is compared to the national value.

County: Miami-Dade

Health / Cancer

Value
Compared to:

County: Miami-Dade

Health / Cancer

Value
Compared to:

County: Miami-Dade Adults with Cancer

Current Value:

County: Miami-Dade Adults with Cancer

5.5%
(2020)
Compared to:
Compared to FL Counties, Miami-Dade has a value of 5.5% which is in the best 50% of counties. Counties in the best 50% have a value lower than 7.7% while counties in the worst 25% have a value higher than 8.6%.
FL Counties
The distribution is based on data from 67 Florida counties.
Compared to U.S. Counties, Miami-Dade has a value of 5.5% which is in the best 50% of counties. Counties in the best 50% have a value lower than 7.6% while counties in the worst 25% have a value higher than 8.3%.
U.S. Counties
The distribution is based on data from 3,141 U.S. counties and county equivalents.
Compared to the US Value (6.5%), Miami-Dade has a value of 5.5% which is lower and better.
US Value
(6.5%)
The regional value is compared to the national value.

County: Miami-Dade Cervical Cancer Screening: 21-65

Current Value:
80.1%
(2020)
Compared to:
Compared to FL Counties, Miami-Dade has a value of 80.1% which is in the best 50% of counties. Counties in the best 50%  have a value higher than 79.5% while counties in the worst 25% have a value lower than 77.5%.
FL Counties
The distribution is based on data from 67 Florida counties.
Compared to U.S. Counties, Miami-Dade has a value of 80.1% which is in the 2nd worst quartile of counties. Counties in the best 50%  have a value higher than 81.0% while counties in the worst 25% have a value lower than 79.3%.
U.S. Counties
The distribution is based on data from 3,141 U.S. counties and county equivalents.
Compared to the US Value (82.8%), Miami-Dade has a value of 80.1% which is lower and worse.
US Value
(82.8%)
The regional value is compared to the national value.

County: Miami-Dade Colon Cancer Screening: Sigmoidoscopy Past 5 Years and FOBT Past 3 Years, Colonoscopy Past 10 Years, or FOBT Past Year

58.4%
(2018)
Compared to:
Compared to FL Counties, Miami-Dade has a value of 58.4% which is in the worst 25% of counties. Counties in the best 50%  have a value higher than 65.0% while counties in the worst 25% have a value lower than 61.2%.
FL Counties
The distribution is based on data from 67 Florida counties.
Compared to U.S. Counties, Miami-Dade has a value of 58.4% which is in the worst 25% of counties. Counties in the best 50%  have a value higher than 64.0% while counties in the worst 25% have a value lower than 61.0%.
U.S. Counties
The distribution is based on data from 3,142 U.S. counties and county equivalents.
Compared to the US Value (66.4%), Miami-Dade has a value of 58.4% which is lower and worse.
US Value
(66.4%)
The regional value is compared to the national value.

County: Miami-Dade Colon Cancer Screening: USPSTF Recommendation

Current Value:
69.0%
(2020)
Compared to:
Compared to FL Counties, Miami-Dade has a value of 69.0% which is in the worst 25% of counties. Counties in the best 50%  have a value higher than 73.2% while counties in the worst 25% have a value lower than 70.1%.
FL Counties
The distribution is based on data from 67 Florida counties.
Compared to U.S. Counties, Miami-Dade has a value of 69.0% which is in the 2nd worst quartile of counties. Counties in the best 50%  have a value higher than 70.7% while counties in the worst 25% have a value lower than 67.7%.
U.S. Counties
The distribution is based on data from 3,141 U.S. counties and county equivalents.
Compared to the US Value (72.4%), Miami-Dade has a value of 69.0% which is lower and worse.
US Value
(72.4%)
The regional value is compared to the national value.

County: Miami-Dade Mammogram: 50-74 Past 2 Years

Current Value:

County: Miami-Dade Mammogram: 50-74 Past 2 Years

72.6%
(2020)
Compared to:
Compared to FL Counties, Miami-Dade has a value of 72.6% which is in the best 50% of counties. Counties in the best 50%  have a value higher than 71.1% while counties in the worst 25% have a value lower than 68.9%.
FL Counties
The distribution is based on data from 67 Florida counties.
Compared to U.S. Counties, Miami-Dade has a value of 72.6% which is in the best 50% of counties. Counties in the best 50%  have a value higher than 70.7% while counties in the worst 25% have a value lower than 67.9%.
U.S. Counties
The distribution is based on data from 3,141 U.S. counties and county equivalents.
Compared to the US Value (78.2%), Miami-Dade has a value of 72.6% which is lower and worse.
US Value
(78.2%)
The regional value is compared to the national value.
Compared to the HP 2030 Target (80.3%), the target has not been met.
HP 2030 Target
(80.3%)

County: Miami-Dade

Health / Health Care Access & Quality

Value
Compared to:

County: Miami-Dade

Health / Health Care Access & Quality

Value
Compared to:

County: Miami-Dade Adults who have had a Routine Checkup

Current Value:
76.1%
(2020)
Compared to:
Compared to FL Counties, Miami-Dade has a value of 76.1% which is in the 2nd worst quartile of counties. Counties in the best 50%  have a value higher than 76.4% while counties in the worst 25% have a value lower than 74.4%.
FL Counties
The distribution is based on data from 67 Florida counties.
Compared to U.S. Counties, Miami-Dade has a value of 76.1% which is in the best 50% of counties. Counties in the best 50%  have a value higher than 76.0% while counties in the worst 25% have a value lower than 73.1%.
U.S. Counties
The distribution is based on data from 3,141 U.S. counties and county equivalents.
Compared to the US Value (74.7%), Miami-Dade has a value of 76.1% which is higher and better.
US Value
(74.7%)
The regional value is compared to the national value.

County: Miami-Dade Adults without Health Insurance

Current Value:

County: Miami-Dade Adults without Health Insurance

31.6%
(2020)
Compared to:
Compared to FL Counties, Miami-Dade has a value of 31.6% which is in the worst 25% of counties. Counties in the best 50% have a value lower than 23.2% while counties in the worst 25% have a value higher than 26.1%.
FL Counties
The distribution is based on data from 67 Florida counties.
Compared to U.S. Counties, Miami-Dade has a value of 31.6% which is in the worst 25% of counties. Counties in the best 50% have a value lower than 14.4% while counties in the worst 25% have a value higher than 18.8%.
U.S. Counties
The distribution is based on data from 3,141 U.S. counties and county equivalents.
Compared to the US Value (15.3%), Miami-Dade has a value of 31.6% which is higher and worse.
US Value
(15.3%)
The regional value is compared to the national value.

County: Miami-Dade

Health / Heart Disease & Stroke

Value
Compared to:

County: Miami-Dade

Health / Heart Disease & Stroke

Value
Compared to:

County: Miami-Dade Adults who Experienced a Stroke

Current Value:

County: Miami-Dade Adults who Experienced a Stroke

3.4%
(2020)
Compared to:
Compared to FL Counties, Miami-Dade has a value of 3.4% which is in the best 50% of counties. Counties in the best 50% have a value lower than 4.4% while counties in the worst 25% have a value higher than 4.8%.
FL Counties
The distribution is based on data from 67 Florida counties.
Compared to U.S. Counties, Miami-Dade has a value of 3.4% which is in the best 50% of counties. Counties in the best 50% have a value lower than 3.8% while counties in the worst 25% have a value higher than 4.4%.
U.S. Counties
The distribution is based on data from 3,141 U.S. counties and county equivalents.
Compared to the US Value (3.2%), Miami-Dade has a value of 3.4% which is higher and worse.
US Value
(3.2%)
The regional value is compared to the national value.

County: Miami-Dade Adults who Experienced Coronary Heart Disease

Current Value:
6.8%
(2020)
Compared to:
Compared to FL Counties, Miami-Dade has a value of 6.8% which is in the best 50% of counties. Counties in the best 50% have a value lower than 9.2% while counties in the worst 25% have a value higher than 9.9%.
FL Counties
The distribution is based on data from 67 Florida counties.
Compared to U.S. Counties, Miami-Dade has a value of 6.8% which is in the best 50% of counties. Counties in the best 50% have a value lower than 8.3% while counties in the worst 25% have a value higher than 9.3%.
U.S. Counties
The distribution is based on data from 3,141 U.S. counties and county equivalents.
Compared to the US Value (6.4%), Miami-Dade has a value of 6.8% which is higher and worse.
US Value
(6.4%)
The regional value is compared to the national value.

County: Miami-Dade Adults who Have Taken Medications for High Blood Pressure

75.7%
(2019)
Compared to:
Compared to FL Counties, Miami-Dade has a value of 75.7% which is in the 2nd worst quartile of counties. Counties in the best 50%  have a value higher than 76.5% while counties in the worst 25% have a value lower than 74.3%.
FL Counties
The distribution is based on data from 67 Florida counties.
Compared to U.S. Counties, Miami-Dade has a value of 75.7% which is in the 2nd worst quartile of counties. Counties in the best 50%  have a value higher than 78.0% while counties in the worst 25% have a value lower than 75.6%.
U.S. Counties
The distribution is based on data from 3,121 U.S. counties and county equivalents.
Compared to the US Value (76.2%), Miami-Dade has a value of 75.7% which is lower and worse.
US Value
(76.2%)
The regional value is compared to the national value.

County: Miami-Dade Cholesterol Test History: 5 Years

Current Value:
86.7%
(2019)
Compared to:
Compared to FL Counties, Miami-Dade has a value of 86.7% which is in the best 50% of counties. Counties in the best 50%  have a value higher than 86.7% while counties in the worst 25% have a value lower than 84.9%.
FL Counties
The distribution is based on data from 67 Florida counties.
Compared to U.S. Counties, Miami-Dade has a value of 86.7% which is in the best 50% of counties. Counties in the best 50%  have a value higher than 85.7% while counties in the worst 25% have a value lower than 84.0%.
U.S. Counties
The distribution is based on data from 3,121 U.S. counties and county equivalents.
Compared to the US Value (87.6%), Miami-Dade has a value of 86.7% which is lower and worse.
US Value
(87.6%)
The regional value is compared to the national value.

County: Miami-Dade High Cholesterol Prevalence: Past 5 Years

Current Value:
31.3%
(2019)
Compared to:
Compared to FL Counties, Miami-Dade has a value of 31.3% which is in the best 50% of counties. Counties in the best 50% have a value lower than 34.7% while counties in the worst 25% have a value higher than 36.2%.
FL Counties
The distribution is based on data from 67 Florida counties.
Compared to U.S. Counties, Miami-Dade has a value of 31.3% which is in the best 50% of counties. Counties in the best 50% have a value lower than 35.5% while counties in the worst 25% have a value higher than 37.7%.
U.S. Counties
The distribution is based on data from 3,121 U.S. counties and county equivalents.
Compared to the US Value (33.6%), Miami-Dade has a value of 31.3% which is lower and better.
US Value
(33.6%)
The regional value is compared to the national value.

County: Miami-Dade

Health / Mental Health & Mental Disorders

Value
Compared to:

County: Miami-Dade

Health / Mental Health & Mental Disorders

Value
Compared to:

County: Miami-Dade Adults Ever Diagnosed with Depression

Current Value:
14.7%
(2020)
Compared to:
Compared to FL Counties, Miami-Dade has a value of 14.7% which is in the best 50% of counties. Counties in the best 50% have a value lower than 19.2% while counties in the worst 25% have a value higher than 20.0%.
FL Counties
The distribution is based on data from 67 Florida counties.
Compared to U.S. Counties, Miami-Dade has a value of 14.7% which is in the best 50% of counties. Counties in the best 50% have a value lower than 21.1% while counties in the worst 25% have a value higher than 23.3%.
U.S. Counties
The distribution is based on data from 3,141 U.S. counties and county equivalents.
Compared to the US Value (18.4%), Miami-Dade has a value of 14.7% which is lower and better.
US Value
(18.4%)
The regional value is compared to the national value.

County: Miami-Dade Poor Mental Health: 14+ Days

Current Value:

County: Miami-Dade Poor Mental Health: 14+ Days

14.4%
(2020)
Compared to:
Compared to FL Counties, Miami-Dade has a value of 14.4% which is in the best 50% of counties. Counties in the best 50% have a value lower than 15.2% while counties in the worst 25% have a value higher than 16.4%.
FL Counties
The distribution is based on data from 67 Florida counties.
Compared to U.S. Counties, Miami-Dade has a value of 14.4% which is in the best 50% of counties. Counties in the best 50% have a value lower than 14.7% while counties in the worst 25% have a value higher than 16.1%.
U.S. Counties
The distribution is based on data from 3,141 U.S. counties and county equivalents.
Compared to the US Value (13.5%), Miami-Dade has a value of 14.4% which is higher and worse.
US Value
(13.5%)
The regional value is compared to the national value.

County: Miami-Dade

Health / Older Adults

Value
Compared to:

County: Miami-Dade

Health / Older Adults

Value
Compared to:

County: Miami-Dade Adults 65+ who Received Recommended Preventive Services: Females

25.9%
(2020)
Compared to:
Compared to FL Counties, Miami-Dade has a value of 25.9% which is in the worst 25% of counties. Counties in the best 50%  have a value higher than 35.2% while counties in the worst 25% have a value lower than 31.8%.
FL Counties
The distribution is based on data from 67 Florida counties.
Compared to U.S. Counties, Miami-Dade has a value of 25.9% which is in the worst 25% of counties. Counties in the best 50%  have a value higher than 36.6% while counties in the worst 25% have a value lower than 33.8%.
U.S. Counties
The distribution is based on data from 3,141 U.S. counties and county equivalents.
Compared to the US Value (37.9%), Miami-Dade has a value of 25.9% which is lower and worse.
US Value
(37.9%)
The regional value is compared to the national value.

County: Miami-Dade Adults 65+ who Received Recommended Preventive Services: Males

29.8%
(2020)
Compared to:
Compared to FL Counties, Miami-Dade has a value of 29.8% which is in the worst 25% of counties. Counties in the best 50%  have a value higher than 38.9% while counties in the worst 25% have a value lower than 35.1%.
FL Counties
The distribution is based on data from 67 Florida counties.
Compared to U.S. Counties, Miami-Dade has a value of 29.8% which is in the worst 25% of counties. Counties in the best 50%  have a value higher than 42.3% while counties in the worst 25% have a value lower than 39.0%.
U.S. Counties
The distribution is based on data from 3,141 U.S. counties and county equivalents.
Compared to the US Value (43.7%), Miami-Dade has a value of 29.8% which is lower and worse.
US Value
(43.7%)
The regional value is compared to the national value.

County: Miami-Dade

Health / Oral Health

Value
Compared to:

County: Miami-Dade

Health / Oral Health

Value
Compared to:

County: Miami-Dade Adults 65+ with Total Tooth Loss

Current Value:
10.8%
(2020)
Compared to:
Compared to FL Counties, Miami-Dade has a value of 10.8% which is in the best 50% of counties. Counties in the best 50% have a value lower than 13.2% while counties in the worst 25% have a value higher than 17.0%.
FL Counties
The distribution is based on data from 67 Florida counties.
Compared to U.S. Counties, Miami-Dade has a value of 10.8% which is in the best 50% of counties. Counties in the best 50% have a value lower than 12.6% while counties in the worst 25% have a value higher than 15.6%.
U.S. Counties
The distribution is based on data from 3,141 U.S. counties and county equivalents.
Compared to the US Value (13.4%), Miami-Dade has a value of 10.8% which is lower and better.
US Value
(13.4%)
The regional value is compared to the national value.

County: Miami-Dade Adults who Visited a Dentist

Current Value:

County: Miami-Dade Adults who Visited a Dentist

57.1%
(2020)
Compared to:
Compared to FL Counties, Miami-Dade has a value of 57.1% which is in the best 50% of counties. Counties in the best 50%  have a value higher than 55.2% while counties in the worst 25% have a value lower than 48.7%.
FL Counties
The distribution is based on data from 67 Florida counties.
Compared to U.S. Counties, Miami-Dade has a value of 57.1% which is in the 2nd worst quartile of counties. Counties in the best 50%  have a value higher than 60.6% while counties in the worst 25% have a value lower than 54.3%.
U.S. Counties
The distribution is based on data from 3,141 U.S. counties and county equivalents.
Compared to the US Value (64.8%), Miami-Dade has a value of 57.1% which is lower and worse.
US Value
(64.8%)
The regional value is compared to the national value.

County: Miami-Dade

Health / Other Conditions

Value
Compared to:

County: Miami-Dade

Health / Other Conditions

Value
Compared to:

County: Miami-Dade Adults with Arthritis

Current Value:

County: Miami-Dade Adults with Arthritis

21.2%
(2020)
Compared to:
Compared to FL Counties, Miami-Dade has a value of 21.2% which is in the best 50% of counties. Counties in the best 50% have a value lower than 29.1% while counties in the worst 25% have a value higher than 31.6%.
FL Counties
The distribution is based on data from 67 Florida counties.
Compared to U.S. Counties, Miami-Dade has a value of 21.2% which is in the best 50% of counties. Counties in the best 50% have a value lower than 29.3% while counties in the worst 25% have a value higher than 32.3%.
U.S. Counties
The distribution is based on data from 3,141 U.S. counties and county equivalents.
Compared to the US Value (24.2%), Miami-Dade has a value of 21.2% which is lower and better.
US Value
(24.2%)
The regional value is compared to the national value.

County: Miami-Dade Adults with Kidney Disease

Current Value:

County: Miami-Dade Adults with Kidney Disease

3.6%
(2020)
Compared to:
Compared to FL Counties, Miami-Dade has a value of 3.6% which is in the best 50% of counties. Counties in the best 50% have a value lower than 3.8% while counties in the worst 25% have a value higher than 4.1%.
FL Counties
The distribution is based on data from 67 Florida counties.
Compared to U.S. Counties, Miami-Dade has a value of 3.6% which is in the 2nd worst quartile of counties. Counties in the best 50% have a value lower than 3.5% while counties in the worst 25% have a value higher than 3.9%.
U.S. Counties
The distribution is based on data from 3,141 U.S. counties and county equivalents.
Compared to the US Value (3.0%), Miami-Dade has a value of 3.6% which is higher and worse.
US Value
(3.0%)
The regional value is compared to the national value.

County: Miami-Dade

Health / Respiratory Diseases

Value
Compared to:

County: Miami-Dade

Health / Respiratory Diseases

Value
Compared to:

County: Miami-Dade Adults with COPD

Current Value:

County: Miami-Dade Adults with COPD

6.2%
Percent of adults
(2020)
Compared to:
Compared to FL Counties, Miami-Dade has a value of 6.2% which is in the best 50% of counties. Counties in the best 50% have a value lower than 10.1% while counties in the worst 25% have a value higher than 11.9%.
FL Counties
The distribution is based on data from 67 Florida counties.
Compared to U.S. Counties, Miami-Dade has a value of 6.2% which is in the best 50% of counties. Counties in the best 50% have a value lower than 8.5% while counties in the worst 25% have a value higher than 10.0%.
U.S. Counties
The distribution is based on data from 3,141 U.S. counties and county equivalents.
Compared to the US Value (6.4%), Miami-Dade has a value of 6.2% which is lower and better.
US Value
(6.4%)
The regional value is compared to the national value.

County: Miami-Dade

Health / Wellness & Lifestyle

Value
Compared to:

County: Miami-Dade

Health / Wellness & Lifestyle

Value
Compared to:

County: Miami-Dade Poor Physical Health: 14+ Days

Current Value:

County: Miami-Dade Poor Physical Health: 14+ Days

12.5%
(2020)
Compared to:
Compared to FL Counties, Miami-Dade has a value of 12.5% which is in the best 50% of counties. Counties in the best 50% have a value lower than 13.0% while counties in the worst 25% have a value higher than 14.9%.
FL Counties
The distribution is based on data from 67 Florida counties.
Compared to U.S. Counties, Miami-Dade has a value of 12.5% which is in the 2nd worst quartile of counties. Counties in the best 50% have a value lower than 11.8% while counties in the worst 25% have a value higher than 13.6%.
U.S. Counties
The distribution is based on data from 3,141 U.S. counties and county equivalents.
Compared to the US Value (10.0%), Miami-Dade has a value of 12.5% which is higher and worse.
US Value
(10.0%)
The regional value is compared to the national value.

County: Miami-Dade Self-Reported General Health Assessment: Poor or Fair

Current Value:
21.0%
(2020)
Compared to:
Compared to FL Counties, Miami-Dade has a value of 21.0% which is in the 2nd worst quartile of counties. Counties in the best 50% have a value lower than 19.1% while counties in the worst 25% have a value higher than 22.7%.
FL Counties
The distribution is based on data from 67 Florida counties.
Compared to U.S. Counties, Miami-Dade has a value of 21.0% which is in the worst 25% of counties. Counties in the best 50% have a value lower than 17.0% while counties in the worst 25% have a value higher than 20.8%.
U.S. Counties
The distribution is based on data from 3,141 U.S. counties and county equivalents.
Compared to the US Value (14.5%), Miami-Dade has a value of 21.0% which is higher and worse.
US Value
(14.5%)
The regional value is compared to the national value.
Miami-Dade Matters