Search for Indicators

Miami-Dade County Community Health Report Card

Welcome to the Miami-Dade County Community Health Report Card. For the PDF report, Miami Matters- Measuring What Matters in Miami Dade County- Community Health Report Card, click here.

The purpose of this Report Card is to develop a comparative, systematic and widely recognized approach for tracking shared priority healthcare indicators so that providers, funders, and other community leaders can effectively assess, target and measure the impact of their coordinated investments in community health and other socio-economic and environmental factors affecting health. The goals and indicators reflected are community selected and are intended to allow for tracking of progress towards improved health outcomes.

Indicator Gauge Icon Legend

Legend Colors

Red is bad, green is good, blue is not statistically different/neutral.

Compared to Distribution

an indicator guage with the arrow in the green 
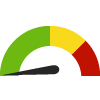
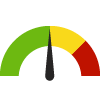
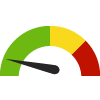
the value is in the best half of communities.

an indicator guage with the arrow in the yellow 
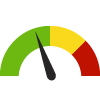
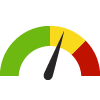
the value is in the 2nd worst quarter of communities.

an indicator guage with the arrow in the red 
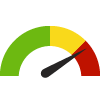
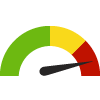
the value is in the worst quarter of communities.

Compared to Target

green circle with white tick inside it meets target; red circle with white cross inside it does not meet target.

Compared to a Single Value

green diamond with downward arrow inside it lower than the comparison value; red diamond with downward arrow inside it higher than the comparison value; blue diamond with downward arrow inside it not statistically different from comparison value.

Trend

green square outline with upward trending arrow inside it green square outline with downward trending arrow inside it non-significant change over time; green square with upward trending arrow inside it green square with downward trending arrow inside it significant change over time; blue square with equals sign no change over time.

Compared to Prior Value

green triangle with upward trending arrow inside it higher than the previous measurement period; green triangle with downward trending arrow inside it lower than the previous measurement period; blue equals sign no statistically different change  from previous measurement period.

More information about the gauges and icons

Infants, children, and mothers are healthy and utilize health and social services

Infants, children, and mothers are healthy and utilize health and social services

Infants, children, and mothers are healthy and utilize health and social services

County: Miami-Dade

Value
Compared to:

Infants, children, and mothers are healthy and utilize health and social services

County: Miami-Dade

Value
Compared to:

County: Miami-Dade Mothers who Received Early Prenatal Care

Current Value:
78.9%
(2022)
Compared to:
Compared to FL Counties, Miami-Dade has a value of 78.9% which is in the best 50% of counties. Counties in the best 50%  have a value higher than 70.7% while counties in the worst 25% have a value lower than 66.8%.
FL Counties
The distribution is based on data from 67 Florida counties.
Compared to the FL Value (71.6%), Miami-Dade has a value of 78.9% which is higher and better.
FL Value
(71.6%)
The regional value is compared to the Florida State value.
Compared to the US Value (78.3%), Miami-Dade has a value of 78.9% which is higher and better.
US Value
(78.3% in 2021)
The regional value is compared to the national value. The source for the national value is Centers for Disease Control and Prevention
Compared to the prior value, Miami-Dade (78.9%) is less and worse than the previously measured value (84.4%).
Prior Value
(84.4%)
Prior Value compares a measured value with the previously measured value. Confidence intervals were not taken into account in determining the direction of the comparison.
Over time, the Miami-Dade value is decreasing, significantly.
Trend
This comparison measures the indicator’s values over multiple time periods.<br>The Mann-Kendall Test for Statistical Significance is used to evaluate the trend<br>over 4 to 10 periods of measure, subject to data availability and comparability.

County: Miami-Dade Infant Mortality Rate

Current Value:

County: Miami-Dade Infant Mortality Rate

5.9
Deaths per 1,000 live births
(2022)
Compared to:
Compared to FL Counties, Miami-Dade has a value of 5.9 which is in the best 50% of counties. Counties in the best 50% have a value lower than 6.6 while counties in the worst 25% have a value higher than 8.3.
FL Counties
The distribution is based on data from 67 Florida counties.
Compared to the FL Value (6.0), Miami-Dade has a value of 5.9 which is lower and better.
FL Value
(6.0)
The regional value is compared to the Florida State value.
Compared to the US Value (5.4), Miami-Dade has a value of 5.9 which is higher and worse.
US Value
(5.4 in 2021)
The regional value is compared to the national value. The source for the national value is Centers for Disease Control and Prevention
Compared to the prior value, Miami-Dade (5.9) is greater and worse than the previously measured value (4.0).
Prior Value
(4.0)
Prior Value compares a measured value with the previously measured value. Confidence intervals were not taken into account in determining the direction of the comparison.
Over time, the Miami-Dade value is increasing, not significantly.
Trend
This comparison measures the indicator’s values over multiple time periods.<br>The Mann-Kendall Test for Statistical Significance is used to evaluate the trend<br>over 4 to 10 periods of measure, subject to data availability and comparability.
Compared to the HP 2030 Target (5.0), the target has not been met.
HP 2030 Target
(5.0)
<div>MICH-02: Reduce the rate of infant deaths <strong>(LEADING HEALTH INDICATOR)</strong></div>

County: Miami-Dade Kindergartners with Required Immunizations

Current Value:
92.0%
(2022)
Compared to:
Compared to FL Counties, Miami-Dade has a value of 92.0% which is in the 2nd worst quartile of counties. Counties in the best 50%  have a value higher than 92.3% while counties in the worst 25% have a value lower than 90.9%.
FL Counties
The distribution is based on data from 67 Florida counties.
Compared to the FL Value (91.7%), Miami-Dade has a value of 92.0% which is higher and better.
FL Value
(91.7%)
The regional value is compared to the Florida State value.
Compared to the prior value, Miami-Dade (92.0%) is less and worse than the previously measured value (92.9%).
Prior Value
(92.9%)
Prior Value compares a measured value with the previously measured value. Confidence intervals were not taken into account in determining the direction of the comparison.
Over time, the Miami-Dade value is increasing significantly.
Trend
This comparison measures the indicator’s values over multiple time periods.<br>The Mann-Kendall Test for Statistical Significance is used to evaluate the trend<br>over 4 to 10 periods of measure, subject to data availability and comparability.

Children, youth, and adults are healthy, practice healthy behaviors and avoid risky behaviors

Children, youth, and adults are healthy, practice healthy behaviors and avoid risky behaviors

Children, youth, and adults are healthy, practice healthy behaviors and avoid risky behaviors

County: Miami-Dade

Value
Compared to:

Children, youth, and adults are healthy, practice healthy behaviors and avoid risky behaviors

County: Miami-Dade

Value
Compared to:

County: Miami-Dade Teens who are Overweight or Obese

Current Value:
29.4%
(2017)
Compared to:
Compared to the FL Value (25.1%), Miami-Dade has a value of 29.4% which is higher and worse.
FL Value
(25.1%)
The regional value is compared to the Florida State value.
Compared to the US Value (30.4%), Miami-Dade has a value of 29.4% which is lower and better.
US Value
(30.4%)
The regional value is compared to the national value.
Compared to the prior value, Miami-Dade (29.4%) is greater and worse than the previously measured value (27.9%).
Prior Value
(27.9%)
Prior Value compares a measured value with the previously measured value. Confidence intervals were not taken into account in determining the direction of the comparison.
Over time, the Miami-Dade value is decreasing, not significantly.
Trend
This comparison measures the indicator’s values over multiple time periods.<br>The Mann-Kendall Test for Statistical Significance is used to evaluate the trend<br>over 4 to 10 periods of measure, subject to data availability and comparability.

County: Miami-Dade Teens who Engage in Regular Physical Activity: High School Students

33.6%
(2017)
Compared to:
Compared to the FL Value (39.3%), Miami-Dade has a value of 33.6% which is lower and worse.
FL Value
(39.3%)
The regional value is compared to the Florida State value.
Compared to the US Value (46.5%), Miami-Dade has a value of 33.6% which is lower and worse.
US Value
(46.5%)
The regional value is compared to the national value.
Compared to the prior value, Miami-Dade (33.6%) is not statistically different from the previously measured value (36.1%).
Prior Value
(36.1%)
Prior Value compares a measured value with the previously measured value. Confidence intervals were taken into account in determining the direction of the comparison.
Over time, the Miami-Dade value is increasing, not significantly.
Trend
This comparison measures the indicator’s values over multiple time periods.<br>The Mann-Kendall Test for Statistical Significance is used to evaluate the trend<br>over 4 to 10 periods of measure, subject to data availability and comparability.

County: Miami-Dade Adults who are Overweight or Obese

Current Value:
61.9%
(2017-2019)
Compared to:
Compared to FL Counties, Miami-Dade has a value of 61.9% which is in the best 50% of counties. Counties in the best 50% have a value lower than 68.5% while counties in the worst 25% have a value higher than 72.2%.
FL Counties
The distribution is based on data from 67 Florida counties.
Compared to the FL Value (64.6%), Miami-Dade has a value of 61.9% which is lower and better.
FL Value
(64.6%)
The regional value is compared to the Florida State value.

County: Miami-Dade Adults who are Sedentary

Current Value:

County: Miami-Dade Adults who are Sedentary

30.7%
(2017-2019)
Compared to:
Compared to FL Counties, Miami-Dade has a value of 30.7% which is in the best 50% of counties. Counties in the best 50% have a value lower than 30.7% while counties in the worst 25% have a value higher than 34.9%.
FL Counties
The distribution is based on data from 67 Florida counties.
Compared to the FL Value (26.5%), Miami-Dade has a value of 30.7% which is higher and worse.
FL Value
(26.5%)
The regional value is compared to the Florida State value.
Compared to the HP 2030 Target (21.8%), the target has not been met.
HP 2030 Target
(21.8%)

County: Miami-Dade Teens who Smoke Cigarettes: High School Students

Current Value:
4.5%
(2017)
Compared to:
Compared to the FL Value (5.7%), Miami-Dade has a value of 4.5% which is lower and better.
FL Value
(5.7%)
The regional value is compared to the Florida State value.
Compared to the US Value (8.8%), Miami-Dade has a value of 4.5% which is lower and better.
US Value
(8.8%)
The regional value is compared to the national value.
Compared to the prior value, Miami-Dade (4.5%) is not statistically different from the previously measured value (5.4%).
Prior Value
(5.4%)
Prior Value compares a measured value with the previously measured value. Confidence intervals were taken into account in determining the direction of the comparison.
Over time, the Miami-Dade value is decreasing, significantly.
Trend
This comparison measures the indicator’s values over multiple time periods.<br>The Mann-Kendall Test for Statistical Significance is used to evaluate the trend<br>over 4 to 10 periods of measure, subject to data availability and comparability.

County: Miami-Dade Teens who Binge Drink: High School Students

Current Value:
8.3%
(2017)
Compared to:
Compared to the FL Value (12.7%), Miami-Dade has a value of 8.3% which is lower and better.
FL Value
(12.7%)
The regional value is compared to the Florida State value.
Compared to the US Value (13.5%), Miami-Dade has a value of 8.3% which is lower and better.
US Value
(13.5%)
The regional value is compared to the national value.
Compared to the prior value, Miami-Dade (8.3%) is less and better than the previously measured value (16.0%).
Prior Value
(16.0%)
Prior Value compares a measured value with the previously measured value. Confidence intervals were taken into account in determining the direction of the comparison.
Over time, the Miami-Dade value is decreasing, not significantly.
Trend
This comparison measures the indicator’s values over multiple time periods.<br>The Mann-Kendall Test for Statistical Significance is used to evaluate the trend<br>over 4 to 10 periods of measure, subject to data availability and comparability.

County: Miami-Dade Adults who Smoke

Current Value:

County: Miami-Dade Adults who Smoke

12.0%
(2017-2019)
Compared to:
Compared to FL Counties, Miami-Dade has a value of 12.0% which is in the best 50% of counties. Counties in the best 50% have a value lower than 18.5% while counties in the worst 25% have a value higher than 22.4%.
FL Counties
The distribution is based on data from 67 Florida counties.
Compared to the FL Value (14.8%), Miami-Dade has a value of 12.0% which is lower and better.
FL Value
(14.8%)
The regional value is compared to the Florida State value.
Compared to the HP 2030 Target (6.1%), the target has not been met.
HP 2030 Target
(6.1%)
<div>TU-02: Reduce current cigarette smoking in adults <strong>(LEADING HEALTH INDICATOR)</strong></div>

County: Miami-Dade Driving Under the Influence Arrest Rate

Current Value:
32.0
Arrests per 100,000 population
(2020)
Compared to:
Compared to FL Counties, Miami-Dade has a value of 32.0 which is in the best 50% of counties. Counties in the best 50% have a value lower than 132.2 while counties in the worst 25% have a value higher than 200.7.
FL Counties
The distribution is based on data from 67 Florida counties.
Compared to the FL Value (134.8), Miami-Dade has a value of 32.0 which is lower and better.
FL Value
(134.8)
The regional value is compared to the Florida State value.
Compared to the prior value, Miami-Dade (32.0) is less and better than the previously measured value (60.8).
Prior Value
(60.8)
Prior Value compares a measured value with the previously measured value. Confidence intervals were not taken into account in determining the direction of the comparison.
Over time, the Miami-Dade value is decreasing, significantly.
Trend
This comparison measures the indicator’s values over multiple time periods.<br>The Mann-Kendall Test for Statistical Significance is used to evaluate the trend<br>over 4 to 10 periods of measure, subject to data availability and comparability.

County: Miami-Dade Teens who are Sexually Active

Current Value:

County: Miami-Dade Teens who are Sexually Active

40.8%
(2017)
Compared to:
Compared to the FL Value (38.1%), Miami-Dade has a value of 40.8% which is higher and worse.
FL Value
(38.1%)
The regional value is compared to the Florida State value.
Compared to the US Value (39.5%), Miami-Dade has a value of 40.8% which is higher and worse.
US Value
(39.5%)
The regional value is compared to the national value.
Compared to the prior value, Miami-Dade (40.8%) is not statistically different from the previously measured value (38.4%).
Prior Value
(38.4%)
Prior Value compares a measured value with the previously measured value. Confidence intervals were taken into account in determining the direction of the comparison.
Over time, the Miami-Dade value is decreasing, significantly.
Trend
This comparison measures the indicator’s values over multiple time periods.<br>The Mann-Kendall Test for Statistical Significance is used to evaluate the trend<br>over 4 to 10 periods of measure, subject to data availability and comparability.

County: Miami-Dade Teen Birth Rate: 15-19

Current Value:

County: Miami-Dade Teen Birth Rate: 15-19

8.8
Live births per 1,000 females aged 15-19
(2022)
Compared to:
Compared to FL Counties, Miami-Dade has a value of 8.8 which is in the best 50% of counties. Counties in the best 50% have a value lower than 19.0 while counties in the worst 25% have a value higher than 26.7.
FL Counties
The distribution is based on data from 67 Florida counties.
Compared to the FL Value (13.2), Miami-Dade has a value of 8.8 which is lower and better.
FL Value
(13.2)
The regional value is compared to the Florida State value.
Compared to the US Value (13.9), Miami-Dade has a value of 8.8 which is lower and better.
US Value
(13.9 in 2021)
The regional value is compared to the national value. The source for the national value is Centers for Disease Control and Prevention, National Center for Health Statistics
Compared to the prior value, Miami-Dade (8.8) is less and better than the previously measured value (9.4).
Prior Value
(9.4)
Prior Value compares a measured value with the previously measured value. Confidence intervals were not taken into account in determining the direction of the comparison.
Over time, the Miami-Dade value is decreasing, significantly.
Trend
This comparison measures the indicator’s values over multiple time periods.<br>The Mann-Kendall Test for Statistical Significance is used to evaluate the trend<br>over 4 to 10 periods of measure, subject to data availability and comparability.

County: Miami-Dade Syphilis Incidence Rate

Current Value:

County: Miami-Dade Syphilis Incidence Rate

27.0
Cases per 100,000 population
(2022)
Compared to:
Compared to FL Counties, Miami-Dade has a value of 27.0 which is in the worst 25% of counties. Counties in the best 50% have a value lower than 13.9 while counties in the worst 25% have a value higher than 23.4.
FL Counties
The distribution is based on data from 67 Florida counties.
Compared to the FL Value (20.7), Miami-Dade has a value of 27.0 which is higher and worse.
FL Value
(20.7)
The regional value is compared to the Florida State value.
Compared to the US Value (12.7), Miami-Dade has a value of 27.0 which is higher and worse.
US Value
(12.7 in 2020)
The regional value is compared to the national value. The source for the national value is National Center for HIV/AIDS, Viral Hepatitis, STD, and TB Prevention
Compared to the prior value, Miami-Dade (27.0) is greater and worse than the previously measured value (25.0).
Prior Value
(25.0)
Prior Value compares a measured value with the previously measured value. Confidence intervals were not taken into account in determining the direction of the comparison.
Over time, the Miami-Dade value is increasing significantly.
Trend
This comparison measures the indicator’s values over multiple time periods.<br>The Mann-Kendall Test for Statistical Significance is used to evaluate the trend<br>over 4 to 10 periods of measure, subject to data availability and comparability.

County: Miami-Dade Chlamydia Incidence Rate

Current Value:

County: Miami-Dade Chlamydia Incidence Rate

514.5
Cases per 100,000 population
(2022)
Compared to:
Compared to FL Counties, Miami-Dade has a value of 514.5 which is in the 2nd worst quartile of counties. Counties in the best 50% have a value lower than 406.9 while counties in the worst 25% have a value higher than 543.2.
FL Counties
The distribution is based on data from 67 Florida counties.
Compared to the FL Value (478.6), Miami-Dade has a value of 514.5 which is higher and worse.
FL Value
(478.6)
The regional value is compared to the Florida State value.
Compared to the US Value (481.3), Miami-Dade has a value of 514.5 which is higher and worse.
US Value
(481.3 in 2020)
The regional value is compared to the national value. The source for the national value is National Center for HIV/AIDS, Viral Hepatitis, STD, and TB Prevention
Compared to the prior value, Miami-Dade (514.5) is greater and worse than the previously measured value (493.5).
Prior Value
(493.5)
Prior Value compares a measured value with the previously measured value. Confidence intervals were not taken into account in determining the direction of the comparison.
Over time, the Miami-Dade value is increasing significantly.
Trend
This comparison measures the indicator’s values over multiple time periods.<br>The Mann-Kendall Test for Statistical Significance is used to evaluate the trend<br>over 4 to 10 periods of measure, subject to data availability and comparability.

County: Miami-Dade Gonorrhea Incidence Rate

Current Value:

County: Miami-Dade Gonorrhea Incidence Rate

231.3
Cases per 100,000 population
(2022)
Compared to:
Compared to FL Counties, Miami-Dade has a value of 231.3 which is in the worst 25% of counties. Counties in the best 50% have a value lower than 135.9 while counties in the worst 25% have a value higher than 216.4.
FL Counties
The distribution is based on data from 67 Florida counties.
Compared to the FL Value (198.5), Miami-Dade has a value of 231.3 which is higher and worse.
FL Value
(198.5)
The regional value is compared to the Florida State value.
Compared to the US Value (206.5), Miami-Dade has a value of 231.3 which is higher and worse.
US Value
(206.5 in 2020)
The regional value is compared to the national value. The source for the national value is National Center for HIV/AIDS, Viral Hepatitis, STD, and TB Prevention
Compared to the prior value, Miami-Dade (231.3) is greater and worse than the previously measured value (219.9).
Prior Value
(219.9)
Prior Value compares a measured value with the previously measured value. Confidence intervals were not taken into account in determining the direction of the comparison.
Over time, the Miami-Dade value is increasing significantly.
Trend
This comparison measures the indicator’s values over multiple time periods.<br>The Mann-Kendall Test for Statistical Significance is used to evaluate the trend<br>over 4 to 10 periods of measure, subject to data availability and comparability.

County: Miami-Dade Age-Adjusted Hospitalization Rate due to Hepatitis

Current Value:
0.8
Hospitalizations per 10,000 population 18+ years
(2019-2021)
Compared to:
Compared to FL Counties, Miami-Dade has a value of 0.8 which is in the best 50% of counties. Counties in the best 50% have a value lower than 2.0 while counties in the worst 25% have a value higher than 2.9.
FL Counties
The distribution is based on data from 49 Florida counties.
Compared to the FL Value (1.9), Miami-Dade has a value of 0.8 which is lower and better.
FL Value
(1.9)
The regional value is compared to the Florida State value.
Compared to the prior value, Miami-Dade (0.8) is not statistically different from the previously measured value (0.7).
Prior Value
(0.7)
Prior Value compares a measured value with the previously measured value. Confidence intervals were taken into account in determining the direction of the comparison.
Over time, the Miami-Dade value is decreasing, not significantly.
Trend
This comparison measures the indicator’s values over multiple time periods.<br>The Mann-Kendall Test for Statistical Significance is used to evaluate the trend<br>over 4 to 10 periods of measure, subject to data availability and comparability.

County: Miami-Dade Tuberculosis Incidence Rate

Current Value:

County: Miami-Dade Tuberculosis Incidence Rate

4.6
Cases per 100,000 population
(2022)
Compared to:
Compared to FL Counties, Miami-Dade has a value of 4.6 which is in the worst 25% of counties. Counties in the best 50% have a value lower than 1.2 while counties in the worst 25% have a value higher than 2.6.
FL Counties
The distribution is based on data from 67 Florida counties.
Compared to the FL Value (2.4), Miami-Dade has a value of 4.6 which is higher and worse.
FL Value
(2.4)
The regional value is compared to the Florida State value.
Compared to the US Value (2.4), Miami-Dade has a value of 4.6 which is higher and worse.
US Value
(2.4 in 2021)
The regional value is compared to the national value. The source for the national value is Centers for Disease Control and Prevention
Compared to the prior value, Miami-Dade (4.6) is greater and worse than the previously measured value (3.6).
Prior Value
(3.6)
Prior Value compares a measured value with the previously measured value. Confidence intervals were not taken into account in determining the direction of the comparison.
Over time, the Miami-Dade value is decreasing, significantly.
Trend
This comparison measures the indicator’s values over multiple time periods.<br>The Mann-Kendall Test for Statistical Significance is used to evaluate the trend<br>over 4 to 10 periods of measure, subject to data availability and comparability.
Compared to the HP 2030 Target (1.4), the target has not been met.
HP 2030 Target
(1.4)

Residents prevent chronic disease and illness

Residents prevent chronic disease and illness

Residents prevent chronic disease and illness

County: Miami-Dade

Value
Compared to:

Residents prevent chronic disease and illness

County: Miami-Dade

Value
Compared to:

County: Miami-Dade Age-Adjusted Death Rate due to Lung Cancer

Current Value:
20.9
Deaths per 100,000 population
(2020-2022)
Compared to:
Compared to FL Counties, Miami-Dade has a value of 20.9 which is in the best 50% of counties. Counties in the best 50% have a value lower than 37.5 while counties in the worst 25% have a value higher than 49.8.
FL Counties
The distribution is based on data from 67 Florida counties.
Compared to the FL Value (30.7), Miami-Dade has a value of 20.9 which is lower and better.
FL Value
(30.7)
The regional value is compared to the Florida State value.
Compared to the US Value (38.5), Miami-Dade has a value of 20.9 which is lower and better.
US Value
(38.5 in 2016)
The regional value is compared to the national value. The source for the national value is National Cancer Institute
Compared to the prior value, Miami-Dade (20.9) is greater and worse than the previously measured value (20.7).
Prior Value
(20.7)
Prior Value compares a measured value with the previously measured value. Confidence intervals were not taken into account in determining the direction of the comparison.
Over time, the Miami-Dade value is decreasing, significantly.
Trend
This comparison measures the indicator’s values over multiple time periods.<br>The Mann-Kendall Test for Statistical Significance is used to evaluate the trend<br>over 4 to 10 periods of measure, subject to data availability and comparability.
Compared to the HP 2030 Target (25.1), the target has  been met.
HP 2030 Target
(25.1)

County: Miami-Dade Age-Adjusted Death Rate due to Colorectal Cancer

Current Value:
12.0
Deaths per 100,000 population
(2020-2022)
Compared to:
Compared to FL Counties, Miami-Dade has a value of 12.0 which is in the best 50% of counties. Counties in the best 50% have a value lower than 13.4 while counties in the worst 25% have a value higher than 16.0.
FL Counties
The distribution is based on data from 67 Florida counties.
Compared to the FL Value (12.2), Miami-Dade has a value of 12.0 which is lower and better.
FL Value
(12.2)
The regional value is compared to the Florida State value.
Compared to the US Value (13.7), Miami-Dade has a value of 12.0 which is lower and better.
US Value
(13.7 in 2016)
The regional value is compared to the national value. The source for the national value is National Cancer Institute
Compared to the prior value, Miami-Dade (12.0) is less and better than the previously measured value (12.1).
Prior Value
(12.1)
Prior Value compares a measured value with the previously measured value. Confidence intervals were not taken into account in determining the direction of the comparison.
Over time, the Miami-Dade value is decreasing, significantly.
Trend
This comparison measures the indicator’s values over multiple time periods.<br>The Mann-Kendall Test for Statistical Significance is used to evaluate the trend<br>over 4 to 10 periods of measure, subject to data availability and comparability.
Compared to the HP 2030 Target (8.9), the target has not been met.
HP 2030 Target
(8.9)

County: Miami-Dade Age-Adjusted Death Rate due to Prostate Cancer

Current Value:
18.5
Deaths per 100,000 males
(2020-2022)
Compared to:
Compared to FL Counties, Miami-Dade has a value of 18.5 which is in the 2nd worst quartile of counties. Counties in the best 50% have a value lower than 17.6 while counties in the worst 25% have a value higher than 21.9.
FL Counties
The distribution is based on data from 67 Florida counties.
Compared to the FL Value (16.6), Miami-Dade has a value of 18.5 which is higher and worse.
FL Value
(16.6)
The regional value is compared to the Florida State value.
Compared to the prior value, Miami-Dade (18.5) is greater and worse than the previously measured value (17.8).
Prior Value
(17.8)
Prior Value compares a measured value with the previously measured value. Confidence intervals were not taken into account in determining the direction of the comparison.
Over time, the Miami-Dade value is increasing, not significantly.
Trend
This comparison measures the indicator’s values over multiple time periods.<br>The Mann-Kendall Test for Statistical Significance is used to evaluate the trend<br>over 4 to 10 periods of measure, subject to data availability and comparability.
Compared to the HP 2030 Target (16.9), the target has not been met.
HP 2030 Target
(16.9)

County: Miami-Dade Mammogram in Past Year: 40+

Current Value:

County: Miami-Dade Mammogram in Past Year: 40+

63.6%
(2016)
Compared to:
Compared to FL Counties, Miami-Dade has a value of 63.6% which is in the best 50% of counties. Counties in the best 50%  have a value higher than 58.2% while counties in the worst 25% have a value lower than 54.4%.
FL Counties
The distribution is based on data from 67 Florida counties.
Compared to the FL Value (60.8%), Miami-Dade has a value of 63.6% which is higher and better.
FL Value
(60.8%)
The regional value is compared to the Florida State value.
Compared to the prior value, Miami-Dade (63.6%) is less and worse than the previously measured value (64.2%).
Prior Value
(64.2%)
Prior Value compares a measured value with the previously measured value. Confidence intervals were not taken into account in determining the direction of the comparison.
Over time, the Miami-Dade value is decreasing, not significantly.
Trend
This comparison measures the indicator’s values over multiple time periods.<br>The Mann-Kendall Test for Statistical Significance is used to evaluate the trend<br>over 4 to 10 periods of measure, subject to data availability and comparability.

County: Miami-Dade Age-Adjusted Death Rate due to Breast Cancer

Current Value:
15.9
Deaths per 100,000 females
(2020-2022)
Compared to:
Compared to FL Counties, Miami-Dade has a value of 15.9 which is in the best 50% of counties. Counties in the best 50% have a value lower than 19.3 while counties in the worst 25% have a value higher than 21.3.
FL Counties
The distribution is based on data from 67 Florida counties.
Compared to the FL Value (18.4), Miami-Dade has a value of 15.9 which is lower and better.
FL Value
(18.4)
The regional value is compared to the Florida State value.
Compared to the US Value (20.0), Miami-Dade has a value of 15.9 which is lower and better.
US Value
(20.0 in 2016)
The regional value is compared to the national value. The source for the national value is National Cancer Institute
Compared to the prior value, Miami-Dade (15.9) is not statistically different from the previously measured value (15.9).
Prior Value
(15.9)
Prior Value compares a measured value with the previously measured value. Confidence intervals were not taken into account in determining the direction of the comparison.
Over time, the Miami-Dade value is increasing, not significantly.
Trend
This comparison measures the indicator’s values over multiple time periods.<br>The Mann-Kendall Test for Statistical Significance is used to evaluate the trend<br>over 4 to 10 periods of measure, subject to data availability and comparability.
Compared to the HP 2030 Target (15.3), the target has not been met.
HP 2030 Target
(15.3)

County: Miami-Dade Pap Test in Past Year

Current Value:

County: Miami-Dade Pap Test in Past Year

52.7%
(2016)
Compared to:
Compared to FL Counties, Miami-Dade has a value of 52.7% which is in the best 50% of counties. Counties in the best 50%  have a value higher than 45.5% while counties in the worst 25% have a value lower than 40.0%.
FL Counties
The distribution is based on data from 67 Florida counties.
Compared to the FL Value (48.4%), Miami-Dade has a value of 52.7% which is higher and better.
FL Value
(48.4%)
The regional value is compared to the Florida State value.
Compared to the prior value, Miami-Dade (52.7%) is less and worse than the previously measured value (53.8%).
Prior Value
(53.8%)
Prior Value compares a measured value with the previously measured value. Confidence intervals were not taken into account in determining the direction of the comparison.
Over time, the Miami-Dade value is decreasing, significantly.
Trend
This comparison measures the indicator’s values over multiple time periods.<br>The Mann-Kendall Test for Statistical Significance is used to evaluate the trend<br>over 4 to 10 periods of measure, subject to data availability and comparability.

County: Miami-Dade Cervical Cancer Incidence Rate

Current Value:

County: Miami-Dade Cervical Cancer Incidence Rate

8.9
Cases per 100,000 females
(2018-2020)
Compared to:
Compared to FL Counties, Miami-Dade has a value of 8.9 which is in the best 50% of counties. Counties in the best 50% have a value lower than 9.5 while counties in the worst 25% have a value higher than 12.1.
FL Counties
The distribution is based on data from 67 Florida counties.
Compared to the FL Value (8.8), Miami-Dade has a value of 8.9 which is higher and worse.
FL Value
(8.8)
The regional value is compared to the Florida State value.
Compared to the prior value, Miami-Dade (8.9) is less and better than the previously measured value (9.2).
Prior Value
(9.2)
Prior Value compares a measured value with the previously measured value. Confidence intervals were not taken into account in determining the direction of the comparison.
Over time, the Miami-Dade value is increasing, not significantly.
Trend
This comparison measures the indicator’s values over multiple time periods.<br>The Mann-Kendall Test for Statistical Significance is used to evaluate the trend<br>over 4 to 10 periods of measure, subject to data availability and comparability.

County: Miami-Dade Age-Adjusted Hospitalization Rate due to Adult Asthma

Current Value:
3.4
Hospitalizations per 10,000 population 18+ years
(2019-2021)
Compared to:
Compared to FL Counties, Miami-Dade has a value of 3.4 which is in the 2nd worst quartile of counties. Counties in the best 50% have a value lower than 3.1 while counties in the worst 25% have a value higher than 4.2.
FL Counties
The distribution is based on data from 54 Florida counties.
Compared to the FL Value (3.7), Miami-Dade has a value of 3.4 which is lower and better.
FL Value
(3.7)
The regional value is compared to the Florida State value.
Compared to the prior value, Miami-Dade (3.4) is less and better than the previously measured value (4.1).
Prior Value
(4.1)
Prior Value compares a measured value with the previously measured value. Confidence intervals were taken into account in determining the direction of the comparison.
Over time, the Miami-Dade value is decreasing, significantly.
Trend
This comparison measures the indicator’s values over multiple time periods.<br>The Mann-Kendall Test for Statistical Significance is used to evaluate the trend<br>over 4 to 10 periods of measure, subject to data availability and comparability.

County: Miami-Dade Age-Adjusted Death Rate due to Influenza and Pneumonia

Current Value:
5.8
Deaths per 100,000 population
(2022)
Compared to:
Compared to FL Counties, Miami-Dade has a value of 5.8 which is in the best 50% of counties. Counties in the best 50% have a value lower than 10.3 while counties in the worst 25% have a value higher than 14.4.
FL Counties
The distribution is based on data from 67 Florida counties.
Compared to the FL Value (8.6), Miami-Dade has a value of 5.8 which is lower and better.
FL Value
(8.6)
The regional value is compared to the Florida State value.
Compared to the US Value (13.0), Miami-Dade has a value of 5.8 which is lower and better.
US Value
(13.0 in 2020)
The regional value is compared to the national value. The source for the national value is Centers for Disease Control and Prevention
Compared to the prior value, Miami-Dade (5.8) is less and better than the previously measured value (7.3).
Prior Value
(7.3)
Prior Value compares a measured value with the previously measured value. Confidence intervals were not taken into account in determining the direction of the comparison.
Over time, the Miami-Dade value is decreasing, not significantly.
Trend
This comparison measures the indicator’s values over multiple time periods.<br>The Mann-Kendall Test for Statistical Significance is used to evaluate the trend<br>over 4 to 10 periods of measure, subject to data availability and comparability.

County: Miami-Dade Age-Adjusted Hospitalization Rate due to COPD

Current Value:
10.5
Hospitalizations per 10,000 population 18+ years
(2019-2021)
Compared to:
Compared to FL Counties, Miami-Dade has a value of 10.5 which is in the best 50% of counties. Counties in the best 50% have a value lower than 16.1 while counties in the worst 25% have a value higher than 19.2.
FL Counties
The distribution is based on data from 67 Florida counties.
Compared to the FL Value (14.6), Miami-Dade has a value of 10.5 which is lower and better.
FL Value
(14.6)
The regional value is compared to the Florida State value.
Compared to the prior value, Miami-Dade (10.5) is less and better than the previously measured value (14.1).
Prior Value
(14.1)
Prior Value compares a measured value with the previously measured value. Confidence intervals were taken into account in determining the direction of the comparison.
Over time, the Miami-Dade value is decreasing, significantly.
Trend
This comparison measures the indicator’s values over multiple time periods.<br>The Mann-Kendall Test for Statistical Significance is used to evaluate the trend<br>over 4 to 10 periods of measure, subject to data availability and comparability.

County: Miami-Dade Age-Adjusted Hospitalization Rate due to Urinary Tract Infections

12.5
Hospitalizations per 10,000 population 18+ years
(2019-2021)
Compared to:
Compared to FL Counties, Miami-Dade has a value of 12.5 which is in the 2nd worst quartile of counties. Counties in the best 50% have a value lower than 12.3 while counties in the worst 25% have a value higher than 13.8.
FL Counties
The distribution is based on data from 67 Florida counties.
Compared to the FL Value (12.4), Miami-Dade has a value of 12.5 which is higher and worse.
FL Value
(12.4)
The regional value is compared to the Florida State value.
Compared to the prior value, Miami-Dade (12.5) is less and better than the previously measured value (14.3).
Prior Value
(14.3)
Prior Value compares a measured value with the previously measured value. Confidence intervals were taken into account in determining the direction of the comparison.
Over time, the Miami-Dade value is decreasing, significantly.
Trend
This comparison measures the indicator’s values over multiple time periods.<br>The Mann-Kendall Test for Statistical Significance is used to evaluate the trend<br>over 4 to 10 periods of measure, subject to data availability and comparability.

County: Miami-Dade Age-Adjusted Death Rate due to Cerebrovascular Disease (Stroke)

51.6
Deaths per 100,000 population
(2022)
Compared to:
Compared to FL Counties, Miami-Dade has a value of 51.6 which is in the 2nd worst quartile of counties. Counties in the best 50% have a value lower than 49.5 while counties in the worst 25% have a value higher than 57.6.
FL Counties
The distribution is based on data from 67 Florida counties.
Compared to the FL Value (47.6), Miami-Dade has a value of 51.6 which is higher and worse.
FL Value
(47.6)
The regional value is compared to the Florida State value.
Compared to the US Value (38.8), Miami-Dade has a value of 51.6 which is higher and worse.
US Value
(38.8 in 2020)
The regional value is compared to the national value. The source for the national value is Centers for Disease Control and Prevention
Compared to the prior value, Miami-Dade (51.6) is less and better than the previously measured value (52.0).
Prior Value
(52.0)
Prior Value compares a measured value with the previously measured value. Confidence intervals were not taken into account in determining the direction of the comparison.
Over time, the Miami-Dade value is increasing significantly.
Trend
This comparison measures the indicator’s values over multiple time periods.<br>The Mann-Kendall Test for Statistical Significance is used to evaluate the trend<br>over 4 to 10 periods of measure, subject to data availability and comparability.
Compared to the HP 2030 Target (33.4), the target has not been met.
HP 2030 Target
(33.4)

County: Miami-Dade Age-Adjusted Death Rate due to Hypertensive Heart Disease

18.1
Deaths per 100,000 population
(2022)
Compared to:
Compared to FL Counties, Miami-Dade has a value of 18.1 which is in the 2nd worst quartile of counties. Counties in the best 50% have a value lower than 14.8 while counties in the worst 25% have a value higher than 20.4.
FL Counties
The distribution is based on data from 67 Florida counties.
Compared to the FL Value (15.0), Miami-Dade has a value of 18.1 which is higher and worse.
FL Value
(15.0)
The regional value is compared to the Florida State value.
Compared to the prior value, Miami-Dade (18.1) is less and better than the previously measured value (19.9).
Prior Value
(19.9)
Prior Value compares a measured value with the previously measured value. Confidence intervals were not taken into account in determining the direction of the comparison.
Over time, the Miami-Dade value is increasing significantly.
Trend
This comparison measures the indicator’s values over multiple time periods.<br>The Mann-Kendall Test for Statistical Significance is used to evaluate the trend<br>over 4 to 10 periods of measure, subject to data availability and comparability.

County: Miami-Dade Age-Adjusted Death Rate due to Diabetes

Current Value:
25.1
Deaths per 100,000 population
(2022)
Compared to:
Compared to FL Counties, Miami-Dade has a value of 25.1 which is in the best 50% of counties. Counties in the best 50% have a value lower than 27.0 while counties in the worst 25% have a value higher than 34.5.
FL Counties
The distribution is based on data from 67 Florida counties.
Compared to the FL Value (22.8), Miami-Dade has a value of 25.1 which is higher and worse.
FL Value
(22.8)
The regional value is compared to the Florida State value.
Compared to the US Value (24.8), Miami-Dade has a value of 25.1 which is higher and worse.
US Value
(24.8 in 2020)
The regional value is compared to the national value. The source for the national value is Centers for Disease Control and Prevention
Compared to the prior value, Miami-Dade (25.1) is less and better than the previously measured value (27.4).
Prior Value
(27.4)
Prior Value compares a measured value with the previously measured value. Confidence intervals were not taken into account in determining the direction of the comparison.
Over time, the Miami-Dade value is increasing, not significantly.
Trend
This comparison measures the indicator’s values over multiple time periods.<br>The Mann-Kendall Test for Statistical Significance is used to evaluate the trend<br>over 4 to 10 periods of measure, subject to data availability and comparability.

Residents will have access to health insurance and healthcare

Residents will have access to health insurance and healthcare

Residents will have access to health insurance and healthcare

County: Miami-Dade

Value
Compared to:

Residents will have access to health insurance and healthcare

County: Miami-Dade

Value
Compared to:

County: Miami-Dade Adults with a Usual Source of Health Care

Current Value:
67.4%
(2017-2019)
Compared to:
Compared to FL Counties, Miami-Dade has a value of 67.4% which is in the worst 25% of counties. Counties in the best 50%  have a value higher than 74.8% while counties in the worst 25% have a value lower than 70.4%.
FL Counties
The distribution is based on data from 67 Florida counties.
Compared to the FL Value (72.0%), Miami-Dade has a value of 67.4% which is lower and worse.
FL Value
(72.0%)
The regional value is compared to the Florida State value.

Families live in safe and supportive environments

Families live in safe and supportive environments

Families live in safe and supportive environments

County: Miami-Dade

Value
Compared to:

Families live in safe and supportive environments

County: Miami-Dade

Value
Compared to:

County: Miami-Dade Age-Adjusted Death Rate due to Motor Vehicle Collisions

12.2
Deaths per 100,000 population
(2022)
Compared to:
Compared to FL Counties, Miami-Dade has a value of 12.2 which is in the best 50% of counties. Counties in the best 50% have a value lower than 19.6 while counties in the worst 25% have a value higher than 30.6.
FL Counties
The distribution is based on data from 67 Florida counties.
Compared to the FL Value (15.8), Miami-Dade has a value of 12.2 which is lower and better.
FL Value
(15.8)
The regional value is compared to the Florida State value.
Compared to the prior value, Miami-Dade (12.2) is not statistically different from the previously measured value (12.2).
Prior Value
(12.2)
Prior Value compares a measured value with the previously measured value. Confidence intervals were not taken into account in determining the direction of the comparison.
Over time, the Miami-Dade value is increasing, not significantly.
Trend
This comparison measures the indicator’s values over multiple time periods.<br>The Mann-Kendall Test for Statistical Significance is used to evaluate the trend<br>over 4 to 10 periods of measure, subject to data availability and comparability.

County: Miami-Dade Age-Adjusted Death Rate due to Unintentional Drowning

Current Value:
1.1
Deaths per 100,000 population
(2022)
Compared to:
Compared to FL Counties, Miami-Dade has a value of 1.1 which is in the best 50% of counties. Counties in the best 50% have a value lower than 1.6 while counties in the worst 25% have a value higher than 3.1.
FL Counties
(2016)
The distribution is based on data from 67 Florida counties.
Compared to the FL Value (2.0), Miami-Dade has a value of 1.1 which is lower and better.
FL Value
(2.0)
The regional value is compared to the Florida State value.
Compared to the prior value, Miami-Dade (1.1) is greater and worse than the previously measured value (0.9).
Prior Value
(0.9)
Prior Value compares a measured value with the previously measured value. Confidence intervals were not taken into account in determining the direction of the comparison.
Over time, the Miami-Dade value is decreasing, significantly.
Trend
This comparison measures the indicator’s values over multiple time periods.<br>The Mann-Kendall Test for Statistical Significance is used to evaluate the trend<br>over 4 to 10 periods of measure, subject to data availability and comparability.

County: Miami-Dade Violent Crime Rate

Current Value:

County: Miami-Dade Violent Crime Rate

463.5
Crimes per 100,000 population
(2020)
Compared to:
Compared to FL Counties, Miami-Dade has a value of 463.5 which is in the 2nd worst quartile of counties. Counties in the best 50% have a value lower than 299.2 while counties in the worst 25% have a value higher than 465.4.
FL Counties
The distribution is based on data from 67 Florida counties.
Compared to the FL Value (384.1), Miami-Dade has a value of 463.5 which is higher and worse.
FL Value
(384.1)
The regional value is compared to the Florida State value.
Compared to the prior value, Miami-Dade (463.5) is less and better than the previously measured value (474.3).
Prior Value
(474.3)
Prior Value compares a measured value with the previously measured value. Confidence intervals were not taken into account in determining the direction of the comparison.
Over time, the Miami-Dade value is decreasing, significantly.
Trend
This comparison measures the indicator’s values over multiple time periods.<br>The Mann-Kendall Test for Statistical Significance is used to evaluate the trend<br>over 4 to 10 periods of measure, subject to data availability and comparability.

County: Miami-Dade Child Abuse Rate

Current Value:

County: Miami-Dade Child Abuse Rate

1.3
Cases per 1,000 children aged 5-11
(2022)
Compared to:
Compared to FL Counties, Miami-Dade has a value of 1.3 which is in the best 50% of counties. Counties in the best 50% have a value lower than 5.9 while counties in the worst 25% have a value higher than 8.8.
FL Counties
The distribution is based on data from 67 Florida counties.
Compared to the FL Value (4.8), Miami-Dade has a value of 1.3 which is lower and better.
FL Value
(4.8)
The regional value is compared to the Florida State value.
Compared to the prior value, Miami-Dade (1.3) is less and better than the previously measured value (1.5).
Prior Value
(1.5)
Prior Value compares a measured value with the previously measured value. Confidence intervals were not taken into account in determining the direction of the comparison.
Over time, the Miami-Dade value is decreasing, significantly.
Trend
This comparison measures the indicator’s values over multiple time periods.<br>The Mann-Kendall Test for Statistical Significance is used to evaluate the trend<br>over 4 to 10 periods of measure, subject to data availability and comparability.

County: Miami-Dade Youths Arrested: 10-17

Current Value:

County: Miami-Dade Youths Arrested: 10-17

3.6
Arrests per 1,000 population aged 0-17
(2021)
Compared to:
Compared to FL Counties, Miami-Dade has a value of 3.6 which is in the best 50% of counties. Counties in the best 50% have a value lower than 12.4 while counties in the worst 25% have a value higher than 17.5.
FL Counties
The distribution is based on data from 67 Florida counties.
Compared to the FL Value (9.7), Miami-Dade has a value of 3.6 which is lower and better.
FL Value
(9.7)
The regional value is compared to the Florida State value.
Compared to the prior value, Miami-Dade (3.6) is less and better than the previously measured value (5.1).
Prior Value
(5.1)
Prior Value compares a measured value with the previously measured value. Confidence intervals were not taken into account in determining the direction of the comparison.
Over time, the Miami-Dade value is decreasing, significantly.
Trend
This comparison measures the indicator’s values over multiple time periods.<br>The Mann-Kendall Test for Statistical Significance is used to evaluate the trend<br>over 4 to 10 periods of measure, subject to data availability and comparability.

Elders are healthy and utilize the healthcare system effectively and efficiently

Elders are healthy and utilize the healthcare system effectively and efficiently

Elders are healthy and utilize the healthcare system effectively and efficiently

County: Miami-Dade

Value
Compared to:

Elders are healthy and utilize the healthcare system effectively and efficiently

County: Miami-Dade

Value
Compared to:

County: Miami-Dade Adults 65+ with Influenza Vaccination

Current Value:
48.1%
(2017-2019)
Compared to:
Compared to FL Counties, Miami-Dade has a value of 48.1% which is in the worst 25% of counties. Counties in the best 50%  have a value higher than 56.4% while counties in the worst 25% have a value lower than 52.4%.
FL Counties
The distribution is based on data from 67 Florida counties.
Compared to the FL Value (58.3%), Miami-Dade has a value of 48.1% which is lower and worse.
FL Value
(58.3%)
The regional value is compared to the Florida State value.

County: Miami-Dade Adults 65+ with Pneumonia Vaccination

Current Value:
54.1%
(2017-2019)
Compared to:
Compared to FL Counties, Miami-Dade has a value of 54.1% which is in the worst 25% of counties. Counties in the best 50%  have a value higher than 68.1% while counties in the worst 25% have a value lower than 63.6%.
FL Counties
The distribution is based on data from 67 Florida counties.
Compared to the FL Value (66.8%), Miami-Dade has a value of 54.1% which is lower and worse.
FL Value
(66.8%)
The regional value is compared to the Florida State value.

County: Miami-Dade Hospitalization Rate due to Hip Fractures Among Females 65+

256.7
Hospitalizations per 100,000 females 65+ years
(2019-2021)
Compared to:
Compared to FL Counties, Miami-Dade has a value of 256.7 which is in the best 50% of counties. Counties in the best 50% have a value lower than 306.9 while counties in the worst 25% have a value higher than 391.1.
FL Counties
The distribution is based on data from 64 Florida counties.
Compared to the FL Value (608.4), Miami-Dade has a value of 256.7 which is lower and better.
FL Value
(608.4)
The regional value is compared to the Florida State value.
Compared to the prior value, Miami-Dade (256.7) is not statistically different from the previously measured value (261.4).
Prior Value
(261.4)
Prior Value compares a measured value with the previously measured value. Confidence intervals were taken into account in determining the direction of the comparison.
Over time, the Miami-Dade value is decreasing, significantly.
Trend
This comparison measures the indicator’s values over multiple time periods.<br>The Mann-Kendall Test for Statistical Significance is used to evaluate the trend<br>over 4 to 10 periods of measure, subject to data availability and comparability.

County: Miami-Dade Hospitalization Rate due to Hip Fractures Among Males 65+

125.6
Hospitalizations per 100,000 males 65+ years
(2019-2021)
Compared to:
Compared to FL Counties, Miami-Dade has a value of 125.6 which is in the best 50% of counties. Counties in the best 50% have a value lower than 161.3 while counties in the worst 25% have a value higher than 205.2.
FL Counties
The distribution is based on data from 54 Florida counties.
Compared to the FL Value (342.2), Miami-Dade has a value of 125.6 which is lower and better.
FL Value
(342.2)
The regional value is compared to the Florida State value.
Compared to the prior value, Miami-Dade (125.6) is not statistically different from the previously measured value (124.2).
Prior Value
(124.2)
Prior Value compares a measured value with the previously measured value. Confidence intervals were taken into account in determining the direction of the comparison.
Over time, the Miami-Dade value is staying the same.
Trend
This comparison measures the indicator’s values over multiple time periods.<br>The Mann-Kendall Test for Statistical Significance is used to evaluate the trend<br>over 4 to 10 periods of measure, subject to data availability and comparability.

County: Miami-Dade Alzheimer's Disease Death Rate, Age 65 and older

Current Value:
185.7
Deaths per 100,000 population
(2014-2016)
Compared to:
Compared to the FL Value (173.7), Miami-Dade has a value of 185.7 which is higher and worse.
FL Value
(173.7)
The regional value is compared to the Florida State value.
Compared to the prior value, Miami-Dade (185.7) is greater and worse than the previously measured value (160.6).
Prior Value
(160.6)
Prior Value compares a measured value with the previously measured value. Confidence intervals were not taken into account in determining the direction of the comparison.
Over time, the Miami-Dade value is increasing, not significantly.
Trend
This comparison measures the indicator’s values over multiple time periods.<br>The Mann-Kendall Test for Statistical Significance is used to evaluate the trend<br>over 4 to 10 periods of measure, subject to data availability and comparability.
Miami-Dade Matters